
Trading Like the 80%
An institutional technical framework. The small set of mechanical, repeatable signals institutions actually trade on, stripped of the retail noise.
1Moving Averages — The Trend Skeleton
Institutions use moving averages as trend-following triggers and trailing stops, not crystal balls. The hierarchy matters. Each line answers a different timeframe question.
| Moving Average | Question it answers | What a break means |
|---|---|---|
| Daily EMA9 | Is momentum still fresh? | First line. A daily close back through it after an extended run is the earliest sign something changed. |
| Daily EMA21 | Is the short-term trend intact? | Confirms or denies the EMA9 signal. Two closes below both = short-term trend broken. |
| Daily SMA50 | Is the intermediate trend intact? | Watched by systematic and quant funds. A break here often triggers real selling, not just noise. |
| Daily SMA200 | Is the long-term structure intact? | The floor. A sustained break below the 200 is a regime change, not a dip. |
How to use it as a beginner:
- Don't act on a Daily EMA9 break alone. Treat it as "pay attention."
- A close below Daily EMA21 = the short-term trend is now in question.
- A close below Daily SMA50 = real institutional participants are likely reducing.
- A close below Daily SMA200 = the long-term trend is broken. Rare and significant.
2VWAP — Where Institutions Actually Transact
VWAP (Volume Weighted Average Price) is the single most important intraday institutional level, and almost no retail trader understands why.
Why it matters: institutional execution algorithms (TWAP/VWAP execution) are graded on whether they filled better or worse than VWAP. Huge blocks of institutional buying and selling cluster around it. It's not an indicator, it's a literal record of where the average dollar traded.
- Price above VWAP = buyers in control for the session; buy algos are paying above average (aggressive).
- Price below VWAP = sellers in control; sell algos are filling at or below average (passive distribution).
- Anchored VWAP (from an event: earnings, a high, a low) shows the average price everyone who entered since that event is sitting at. A real S/R level, because it's where a large cohort's cost basis sits.
3Volume Profile — Where Size Actually Sits
The real answer to "where's the volume, not where's the noise." Forget candle patterns. Volume profile shows at which price levels the most contracts/shares actually traded, not just how many traded in a day.
| Concept | What it means |
|---|---|
| POC (Point of Control) | The single price level with the highest traded volume in the window. Acts as a magnet, price gravitates back to it. |
| Value Area (VA) | The range holding ~70% of volume. Inside VA = fair value, balanced. Outside VA = discovery, trending. |
| High Volume Node (HVN) | A price shelf where lots of volume transacted. Acts as support/resistance because many participants have a stake there. |
| Low Volume Node (LVN) | A gap where little volume transacted. Price moves through these fast, no one's there to defend it. |
4Market Structure — Higher Highs, Higher Lows, and the Break
The only "pattern" concept that matters institutionally, because it's literally how trend is defined mechanically.
- Uptrend = sequence of higher highs (HH) and higher lows (HL).
- Downtrend = sequence of lower highs (LH) and lower lows (LL).
- Break of Structure (BOS) = a new HH/LL in the trend direction. Continuation confirmed.
- Change of Character (CHoCH) = price fails to make a new HH and breaks below the most recent HL. First objective sign the trend flipped.
5Liquidity and Stop Hunts — Where the "Sharks" Actually Are
You don't need a shark/whale/dolphin taxonomy. What retail calls "manipulation" is just this:
- Retail stops cluster in predictable places: just below obvious swing lows, just above obvious swing highs, round numbers ($200, $250).
- Institutions need liquidity (someone on the other side) to fill large orders without moving price against themselves.
- Price often runs through these obvious levels first (triggering retail stops = free liquidity), then reverses.
6Putting It Together — A Simple Weekly Checklist
For any position you're holding or considering, answer these five questions using only the tools above:
What to Explicitly Ignore
- Named candlestick patterns in isolation (doji, hammer) — statistically weak without context from the tools above.
- Fibonacci retracements as a standalone signal — only meaningful when they align with an HVN/POC or a structural level.
- Any indicator combo needing more than 2 to 3 inputs to interpret — if your entry takes a paragraph to explain, it's not what's moving the 80%.
- Volume profile "animal" terminology (sharks, whales, dolphins) — retail branding on top of order-size buckets, not a real framework.
7Daily Top-Down Sequence — Instrument Order
Before looking at any single name, work top-down through correlated instruments. Each level confirms or contradicts the one above it. Disagreement between levels is itself a signal.
| Step | Instrument | What it tells you |
|---|---|---|
| 1 | NQ (futures) | Tech-macro tone, pre-market. |
| 2 | ES (futures) | Broad market tone, pre-market. |
| 3 | QQQ / SPY (cash proxy) | Confirms or denies the futures read once the market opens. |
| 4 | SMH (semis sector) | Is money rotating into/out of chips specifically, independent of the broad tape. |
| 5 | DRAM/memory (MU, WDC, SNDK) | Sub-sector confirmation. The memory cycle can lead or lag logic chips. |
| 6 | Your watchlist (NVDA, ARM) | Assessed last, with full context already loaded. |
8Timeframe to Action — Long-Term Positioning vs. Intraday Execution
Different timeframes answer different questions. Confusing them causes stress-driven mistakes. A long-term thesis doesn't get invalidated by a 5-minute chart, and a scalp doesn't need a weekly read.
| Timeframe | Question it answers | What you actually DO with it |
|---|---|---|
| Weekly | Is the multi-month/year thesis intact? | Hold, add to, or exit a LEAPS/long-dated position. Rarely changes week to week. Revisit only on a major structural break (weekly close through Weekly SMA50 or a multi-month trendline). |
| Daily | Is the current swing/trend intact? | Add size, trim, hedge, or hold. Your once-a-day "am I still positioned correctly" check. |
| 1hr / 4hr | Is today's session confirming or fighting the daily read? | Refine entry/exit zones for anything you're actively working today. Times the daily bias, doesn't override it. |
| 5m / 2m | Where exactly do I get in or out right now? | Pure execution. Entries, exits, adds, scalps. Never make a thesis decision on this timeframe. |
Applying this to a long-dated position (e.g., LEAPS)
- Weekly chart sets the thesis. Is the multi-month trend/structure still intact? This justifies holding through daily-level chop.
- Daily chart is your management tool. Where you decide to trim, hedge, or add, based on the Daily EMA9/21/50/200 stack and structure (HH/HL vs LH/LL).
- Intraday (1hr down to 2m) only matters if you're actively trading around the core position (partial profit-taking, tactical hedges). It should never change your view on the LEAPS itself.
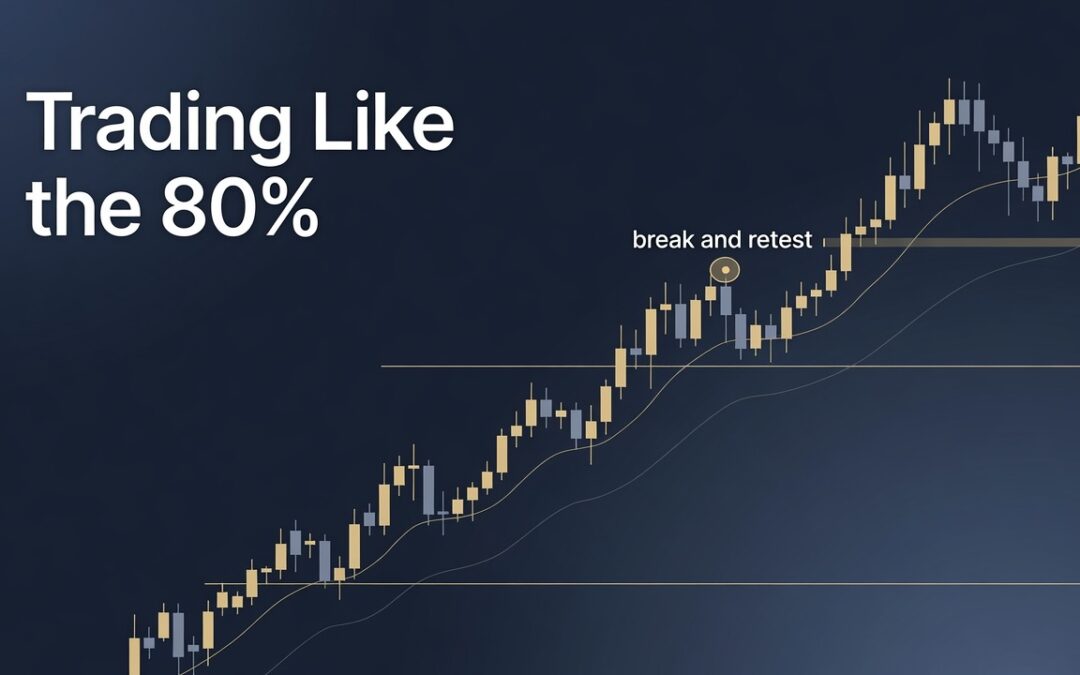
Break and Retest — The Actual Entry/Exit Trigger
A level breaking (HVN, POC, prior swing high/low, moving average) is not the signal. The retest is.
Why retest > break: the initial break can be a low-volume move through an LVN, fast and unreliable. The retest lets you see if real participants defend the new level, and lets you place a defined stop (below/above the retested level) instead of guessing.
Quick Reference
| Tool | Timeframe | Question it answers | Where to find it |
|---|---|---|---|
| Daily EMA9/21/50/200 | Days to months | Is the trend intact? | Any charting platform, daily chart |
| VWAP / Anchored VWAP | Intraday to weeks | Where is average institutional cost basis? | TradingView, most platforms |
| Volume Profile (POC/VA/HVN/LVN) | Weeks to months | Where does size actually sit? | TradingView Volume Profile tool |
| Market Structure (HH/HL, BOS/CHoCH) | Any | Is the trend continuing or reversing? | Manual swing marking, any chart |
| Liquidity zones (stop clusters) | Any | Where will price get pulled before reversing? | Manual, obvious swings and round numbers |
| Top-down instrument sequence | NQ/ES to watchlist | Name-specific, sector-specific, or market-wide? | Manual daily prep routine |
| Break and retest | Any | Is a broken level real or a trap? | Manual, wait for the pullback |
Educational framework for discipline and process. Not financial advice. Every level and timeframe reference assumes you define your own risk before entry.